Friday, December 18, 2009

Tool - Wordpress Bruteforcer (WP_BruteForcer.exe)

Wordpress Brute Force Tool

Hoho, the chritmas is around the corner and here is my christmas gift that would like to share with others. This is a brute forcing tool that targets the Wordpress web application.

Here is the demo on how to use the tool to break Wordpress password:


Figure 1: WP_BruteForcer Usage


Figure 2: Brute force the wordpress application


Figure 3: Password cracking


Figure 4: Target Website (Dummy one ;))


Figure 5: Ready to crack the website


Figure 6: Owned!!!

Note:

It would be a good idea to run the tool in Windows platform although wine environment can be used also but the tool is not stable for some reason (I didn't investigate further in this case ;))

Download Link

http://www.4shared.com/file/175981151/3f124165/WP_BruteForcer_final.html

~Signing off
@x9090

Thursday, September 24, 2009

"Sorry, this database has been created by a pirate version of IDA Pro"


Patching ida.wll


Target: IDA Pro Version 5.2.0.911 & Version 5.5

Some of you might encounter this error message before when you are trying to open an idb (ida database file) file. This will only happen if the idb is created by a pirated copy of IDA Pro like the screenshot below:

Someone from exetools.com has posted the patch but only limited for those who have registered as a member. Based on the description there, it is not hard to patch the pirated message actually.

The step is fairly easy:

  1. Find ida.wll from your IDA installation directory and load it with IDA
  2. Find text string "Sorry, this database has been created by a pirate version of IDA Pro" by using Shift+F12 (Strings tab)
  3. Enter to jump to the data section
  4. You should see aSorryThisDatab attribute which is already defined with the above string
  5. Put your cursor to the attribute and press x (Cross reference) to jump to the code section that uses this data
  6. You should now jump to the code which looks like this:


  7. Notice the jz before the "call sub_10039660", double click to enter sub_10039660 function
  8. You can see the 3 exported functions MD5Init, MD5Update and MD5Final.
  9. Go to the part where it nears the retn instruction.
  10. And take note how EAX is updated because this register will determine if the hash is equal or not and return to the previous function that will do the comparison, "test al, al"
  11. From the figure above, we know that we can avoid the pirated message if EAX is zero. So we can patch "mov al,1" to something that will give us EAX=0, eg: "xor eax, eax" ;)
  12. Using any hex editor that you prefer, and jump to this address and do the modification. Done!!!

Download: ida.wll.patched


Reference

Datarescue IDA pirated .idb database -- http://forum.exetools.com/showthread.php?t=12087

~Signing off
@x9090

Monday, September 14, 2009

Ollyscript Tutorial - Unpack ASPack

ASPack is actually similar to UPX.

Using PEiD: ASPack 2.12 -> Alexey Solodovnikov

The script
-----------

var hwBP // Local var for hwBP

mov hwBP, esp // Using esp trick

bphws hwBP, "r" // Set hardware breakpoint

run // Run

rtr // Execute till return

sto // F8

msg "OEP found"

cmt eip, "<<<<>>>>"

ret

Download: Notepad.exe packed with ASPack

Signing off
~x9090

Thursday, September 10, 2009

[DOC] Understanding DKOM with WinDBG

Process hiding can be achieved by using a technique called DKOM (Direct Kernel Object Manipulation). I started to discover this when I first read the book Rootkit: Subverting the Windows Kernel.


WinDBG

Using Task Manager (Ctrl + Alt + Del) and we see the list of processes:


We can find the chain of active processes by looking at the global kernel variable which is not exported by the kernel and undocumented PsActiveProcessHead.

PsActiveProcessHead contains a linked list LIST_ENTRY for the current active processes being processed by the kernel.

The "system" process is always in the FIRST ENTRY which can be found by calling kernel API PsInitialSystemProcess. The function will return a pointer to the EPROCESS structure of "system" process. The EPROCESS.ActiveProcessLinks.Blink is the PsActiveProcessHead. To verify that:

Let's see the EPROCESS and LIST_ENTRY structure

kd> dt _eprocess
ntdll!_EPROCESS

+0x000 Pcb : _KPROCESS
+0x06c ProcessLock : _EX_PUSH_LOCK
+0x070 CreateTime : _LARGE_INTEGER
+0x078 ExitTime : _LARGE_INTEGER
+0x080 RundownProtect : _EX_RUNDOWN_REF
+0x084 UniqueProcessId : Ptr32 Void
+0x088 ActiveProcessLinks : _LIST_ENTRY
+0x090 QuotaUsage : [3] Uint4B
+0x09c QuotaPeak : [3] Uint4B
+0x0a8 CommitCharge : Uint4B
+0x0ac PeakVirtualSize : Uint4B
+0x0b0 VirtualSize : Uint4B
+0x0b4 SessionProcessLinks : _LIST_ENTRY
+0x0bc DebugPort : Ptr32 Void
+0x0c0 ExceptionPort : Ptr32 Void
+0x0c4 ObjectTable : Ptr32 _HANDLE_TABLE
+0x0c8 Token : _EX_FAST_REF
+0x0cc WorkingSetLock : _FAST_MUTEX
+0x0ec WorkingSetPage : Uint4B
+0x0f0 AddressCreationLock : _FAST_MUTEX
+0x110 HyperSpaceLock : Uint4B
+0x114 ForkInProgress : Ptr32 _ETHREAD
+0x118 HardwareTrigger : Uint4B
+0x11c VadRoot : Ptr32 Void
+0x120 VadHint : Ptr32 Void
+0x124 CloneRoot : Ptr32 Void
+0x128 NumberOfPrivatePages : Uint4B
+0x12c NumberOfLockedPages : Uint4B
+0x130 Win32Process : Ptr32 Void
+0x134 Job : Ptr32 _EJOB
+0x138 SectionObject : Ptr32 Void
+0x13c SectionBaseAddress : Ptr32 Void
+0x140 QuotaBlock : Ptr32 _EPROCESS_QUOTA_BLOCK
+0x144 WorkingSetWatch : Ptr32 _PAGEFAULT_HISTORY
+0x148 Win32WindowStation : Ptr32 Void
+0x14c InheritedFromUniqueProcessId : Ptr32 Void
+0x150 LdtInformation : Ptr32 Void
+0x154 VadFreeHint : Ptr32 Void
+0x158 VdmObjects : Ptr32 Void
+0x15c DeviceMap : Ptr32 Void
+0x160 PhysicalVadList : _LIST_ENTRY
+0x168 PageDirectoryPte : _HARDWARE_PTE_X86
+0x168 Filler : Uint8B
+0x170 Session : Ptr32 Void
+0x174 ImageFileName : [16] UChar
+0x184 JobLinks : _LIST_ENTRY
+0x18c LockedPagesList : Ptr32 Void
+0x190 ThreadListHead : _LIST_ENTRY
+0x198 SecurityPort : Ptr32 Void
+0x19c PaeTop : Ptr32 Void
+0x1a0 ActiveThreads : Uint4B
+0x1a4 GrantedAccess : Uint4B
+0x1a8 DefaultHardErrorProcessing : Uint4B
+0x1ac LastThreadExitStatus : Int4B
+0x1b0 Peb : Ptr32 _PEB
+0x1b4 PrefetchTrace : _EX_FAST_REF
+0x1b8 ReadOperationCount : _LARGE_INTEGER
+0x1c0 WriteOperationCount : _LARGE_INTEGER
+0x1c8 OtherOperationCount : _LARGE_INTEGER
+0x1d0 ReadTransferCount : _LARGE_INTEGER
+0x1d8 WriteTransferCount : _LARGE_INTEGER
+0x1e0 OtherTransferCount : _LARGE_INTEGER
+0x1e8 CommitChargeLimit : Uint4B
+0x1ec CommitChargePeak : Uint4B
+0x1f0 AweInfo : Ptr32 Void
+0x1f4 SeAuditProcessCreationInfo : _SE_AUDIT_PROCESS_CREATION_INFO
+0x1f8 Vm : _MMSUPPORT
+0x238 LastFaultCount : Uint4B
+0x23c ModifiedPageCount : Uint4B
+0x240 NumberOfVads : Uint4B
+0x244 JobStatus : Uint4B
+0x248 Flags : Uint4B
+0x248 CreateReported : Pos 0, 1 Bit
+0x248 NoDebugInherit : Pos 1, 1 Bit
+0x248 ProcessExiting : Pos 2, 1 Bit
+0x248 ProcessDelete : Pos 3, 1 Bit
+0x248 Wow64SplitPages : Pos 4, 1 Bit
+0x248 VmDeleted : Pos 5, 1 Bit
+0x248 OutswapEnabled : Pos 6, 1 Bit
+0x248 Outswapped : Pos 7, 1 Bit
+0x248 ForkFailed : Pos 8, 1 Bit
+0x248 HasPhysicalVad : Pos 9, 1 Bit
+0x248 AddressSpaceInitialized : Pos 10, 2 Bits
+0x248 SetTimerResolution : Pos 12, 1 Bit
+0x248 BreakOnTermination : Pos 13, 1 Bit
+0x248 SessionCreationUnderway : Pos 14, 1 Bit
+0x248 WriteWatch : Pos 15, 1 Bit
+0x248 ProcessInSession : Pos 16, 1 Bit
+0x248 OverrideAddressSpace : Pos 17, 1 Bit
+0x248 HasAddressSpace : Pos 18, 1 Bit
+0x248 LaunchPrefetched : Pos 19, 1 Bit
+0x248 InjectInpageErrors : Pos 20, 1 Bit
+0x248 VmTopDown : Pos 21, 1 Bit
+0x248 Unused3 : Pos 22, 1 Bit
+0x248 Unused4 : Pos 23, 1 Bit
+0x248 VdmAllowed : Pos 24, 1 Bit
+0x248 Unused : Pos 25, 5 Bits
+0x248 Unused1 : Pos 30, 1 Bit
+0x248 Unused2 : Pos 31, 1 Bit
+0x24c ExitStatus : Int4B
+0x250 NextPageColor : Uint2B
+0x252 SubSystemMinorVersion : UChar
+0x253 SubSystemMajorVersion : UChar
+0x252 SubSystemVersion : Uint2B
+0x254 PriorityClass : UChar
+0x255 WorkingSetAcquiredUnsafe : UChar
+0x258 Cookie : Uint4B

You can also check the structure on this page: http://www.acc.umu.se/~bosse/ntifs.h
kd> dt _list_entry
ntdll!_LIST_ENTRY

+0x000 Flink : Ptr32 _LIST_ENTRY
+0x004 Blink : Ptr32 _LIST_ENTRY

We first start to verify PsActiveProcessHead by checking the linked list:

kd> dl nt!psactiveprocesshead 100 2

Addr Flink Blink

805627b8 825c68b8 82499c68
825c68b8 821f2818 805627b8
821f2818 8211b680 825c68b8
8211b680 8229fe28 821f2818
8229fe28 820bde28 8211b680
820bde28 8220fe28 8229fe28
8220fe28 82290910 820bde28
82290910 821c90a8 8220fe28
821c90a8 8223e3a0 82290910
8223e3a0 82102c98 821c90a8
82102c98 8216b3a0 8223e3a0
8216b3a0 820f8680 82102c98
820f8680 82176aa8 8216b3a0
82176aa8 821611b8 820f8680
821611b8 8221ce28 82176aa8
8221ce28 8218f5b0 821611b8
8218f5b0 822484e8 8221ce28
822484e8 82252aa8 8218f5b0
82252aa8 821fb258 822484e8
821fb258 82147770 82252aa8
82147770 821cfc40 821fb258
821cfc40 8218daa8 82147770
8218daa8 820f7538 821cfc40
820f7538 822153a0 8218daa8
822153a0 8211fe28 820f7538
8211fe28 825cb908 822153a0
825cb908 82128e28 8211fe28
82128e28 820f3510 825cb908
820f3510 8210ce28 82128e28
8210ce28 820fd7c8 820f3510
820fd7c8 82234630 8210ce28
82234630 821da510 820fd7c8
821da510 821a9658 82234630
821a9658 82143c40 821da510
82143c40 822a80a8 821a9658
822a80a8 8230b0a8 82143c40
8230b0a8 8231d2d8 822a80a8
8231d2d8 821f4b20 8230b0a8
821f4b20 82499c68 8231d2d8
82499c68 805627b8 821f4b20


We can then use Kernel API PsInitialSystemProcess to look for the address of PsActiveProcessHead which should be 0x805627b8

kd> dt _eprocess activeprocesslinks.blink poi(psinitialsystemprocess)
ntdll!_EPROCESS
+0x088 ActiveProcessLinks : [ 0x821f2818 - 0x805627b8 ]
+0x004 Blink : 0x805627b8 _LIST_ENTRY [ 0x825c68b8 - 0x82499c68 ]

We prove that 0x805627b8 is the address of PsActiveProcessHead that contains linked list of ActiveProcessLinks [Flink & Blink] for "system" process [Flink=0x825c68b8, Blink=0x82499c68] process, in order to verify that:


We take "system" process Flink address 0x825c68b8-0x88 in order to get its EPROCESS structure (please refer to "dt _eprocess" and check the offset of ActiveProcessLinks=Flink):

kd> dt _eprocess 0x825c68b8-0x88
ntdll!_EPROCESS

+0x000 Pcb : _KPROCESS
+0x06c ProcessLock : _EX_PUSH_LOCK
+0x070 CreateTime : _LARGE_INTEGER 0x0
+0x078 ExitTime : _LARGE_INTEGER 0x0
+0x080 RundownProtect : _EX_RUNDOWN_REF
+0x084 UniqueProcessId : 0x00000004
+0x088 ActiveProcessLinks : _LIST_ENTRY [ 0x821f2818 - 0x805627b8 ]

...
+0x174 ImageFileName : [16] "System"
...
The ImageFileName gives us the process name which is "system" and the "system" process always has the process id 4 (UniqueProcessId: 0x00000004)


Hiding Processes

So we know that [ 0x821f2818 - 0x805627b8 ] is the start of the active process chain. In order to hide the processes, we can remove the EPROCESS structure from this chain. For simplicity, I'll "remove" all the chains that's mean hiding all the processes:


kd> ed 805627b8
805627b8 825c68b8
Input> 805627b8

Use ed command to edit the memory address @ 0x805627b8 (remember this is PsActiveProcessHead and it is always start with "system" process) and the debugger is waiting for your input. So just edit the address to point back to itself 0x805627b8

The result would be:


References:

Rootkit: Subverting the Windows Kernel (Page 169) - Direct Kernel Object Manipulation
http://www.rootkit.com/vault/Opc0de/GetVarXP.pdf - Finding Kernel Global Variables
http://www.xfocus.net/articles/200408/724.html - 获取Windows 系统的内核变量

Wednesday, July 22, 2009

Ollyscript Tutorial - Unpack UPX

This is the simplest Ollyscript tutorial to demonstrate how to write Ollydbg script.

var hwdBP // Local variable to store hardware breakpoint
var softBP
// Local variable to strore software breakpoint
sti
// Step into F7 command
findop eip, #61#
// find next POPAD
mov hwdBP, $RESULT
// Store $RESULT to hardware breakpoint local variable
bphws hwdBP, "x"
// Set hardware breakpoint (execute) on the next POPAD
run
// Run F9 command
findop eip, #E9????????#
// Find the next JMP
mov softBP, $RESULT
// Store $RESULT to software breakpoint local variable
bp softBP
run
// Run to JMP instruction
sti
// Step into the OEP
cmt eip, "<<>>"
msg "OEP found, you can dump the file starting from this address"
ret

Downloads:

Ollyscript Editor V2.0
Ollyscript Plugin V0.94 - ORIGINAL_README.txt - List of Ollyscript Commands by SHaG
ARTeam_eZine_Number2.rar - Page 36 - Writing OllyDbg Scripts, Buzifer of Team RESURRECTiON from ARTeam

Signing off
~x9090

Tuesday, July 21, 2009

Joke?Malware?

I found an interesting malware, but strictly speaking it is not really a malware. Instead it plays joke on the machine and does not lead to any harmful activities.

This is the latest scan result from Virscan.


I manage to reverse it and produce the source code. The source code is attached.

Attachment: Joke.c

Have fun! ;)

Signing off
~x9090

Saturday, May 30, 2009

SWF Exploit Analysis - Part 2

Overview

After we obtain the shellcode from the exploited SWF in the previous post, we can understand what is its payload (action of the malware). But before that we should deobfuscate the shellcode first if not it is impossible for us to continue the malware's behavior analysis.


Analysis of shellcode

Again this is the extracted file from the exploit:


You can load the file with IDA Pro and remember to use 32-bit disassembler mode. Do a full code analysis (Highlight all the code > Press C > Select Force analysis) and here is the result and its decryption routine:


The reason why I think this is the decryption routine is very simple. Because the code make sense to me ;)

The encrypted code will call the decryption routine before executing the payload. By looking at the CALL instructions, I found this portion of code make sense to me:

000000EB call loc_F0 ; Call the decryptor code
000000F0
000000F0 loc_F0: ; DATA XREF: 000000EB
000000F0 pop ebp ; Save the original values of stack in EBP
000000F1 add ebp, 14h ; Increment the frame pointer by 14h
000000F4 mov ecx, 18Bh ; Set ECX to 18Bh as a counter
000000F9 mov al, 3Dh ; '=' ; Save the XOR key "3D" to AL
000000FB
000000FB loc_FB: ; CODE XREF: 00000100
000000FB xor [ebp+0], al ; XOR the current frame pointer value+0 against AL with "3D" as the key
000000FE inc ebp ; Increment the current frame pointer by 1
000000FF dec ecx ; Decrement the counter ECX by 1
00000100 jnz short loc_FB ; Go back to XOR instruction (offset FB) if counter is not zero
00000102 jmp short loc_104 ; THIS IS THE POINT WHERE AFTER THE DECRYPTION ROUTINE, IT WILL JUMP TO THE DECRYPTED CODE
00000104 ; ---------------------------------------------------------------------------
00000104
00000104 loc_104: ; DATA XREF: 00000102
00000104 lodsd
00000105 lodsd
00000106 lodsd
00000107 lodsd
00000108 lodsd
00000109 lodsd
0000010A lodsd
0000010B lodsd

I will be more than happy if anyone can tell me other ways to explain why this is the decryptor code if my own assumption is wrong :)

So I will use Hiew again to decrypt the code. Take note the offset 102 where the instruction jump to offset 104 which is the offset where the decryption should start from and:

Press F3 > F8 and set the XOR key as "3D":


Based on the ECX counter, we know the size of the code that needs to be decrypted is 18B that is until offset 28F:


Save the file F9 and you can see the URL that the malware trying to connect and download additional malicious file:


Shellcode Static Analysis

The shellcode is designed to be as small as possible. So it normally contains the actual malicious payloads without importing any API functions to the code itself. So how does the shellcode operate without the necessary APIs.

As we are performing a static analysis, the following assumptions have been made:

  • It will first dyamically retrieve the RVA of kernel32.dll
  • Find kernel32.dll->LoadLibrary() to load other neccessary APIs
  • Load urlmon.dll->URLDownloadToFile() to download additional malicious files
  • Load kernel32.dll->WinExec() to execute the downloaded malicious files


First of all, you might need a copy of Windows Memory Layout, User-Kernel Address Spaces and PE Format Diagram as a reference for PEB structure and PE format


seg000:0000000D pop edi
seg000:0000000E mov eax, [fs:30] ; Save PEB struc to EAX
seg000:00000014 js short loc_22
seg000:00000016 mov eax, [eax+0Ch] ; Get PEB_LDR_DATA struct and save to EAX
seg000:00000019 mov esi, [eax+1Ch] ; PEB_LDR_DATA contains 7 elements and the last elements is InInitializationOrderModuleList (@ offset 1Ch) contains the loaded modules which are linked together
seg000:0000001C lodsd
seg000:0000001D mov ebp, [eax+8] ; ; Each module is represented by LIST_ENTRY which is 4bytes long. This is the image base of kernel32.dll which is stored to ebp
seg000:00000020 jmp short loc_2B


Open Windows Memory Layout, User-Kernel Address Spaces and refer to struct_TEB. Locate offset 0x030 which points to _PEB structure.


From struct_PEB, move to offset 0x0c which is _PEB_LDR_DATA structure that contains 7 elements:


typedef struct _PEB_LDR_DATA {
ULONG Length; //0x000
BOOLEAN Initialized; //0x004
PVOID SsHandle; //0x008
LIST_ENTRY InLoadOrderModuleList; //0x00c
LIST_ENTRY InMemoryOrderModuleList; //0x014
LIST_ENTRY InInitializationOrderModuleList; //0x01c
EntryInProgress / /0x024
} PEB_LDR_DATA, *PPEB_LDR_DATA;


InInitializationOrderModuleList
is a double linked list containing pointers to LDR_MODULE structure:

typedef struct _LIST_ENTRY {
Flink; //0x000
Blink; // 0x004
} LIST_ENTRY, *PLIST_ENTRY

Using this chain, we can browse every DLL modules that are loaded by the processes and therefore we can find kernel32.dll. This is where the shellcode can find kernel32.dll as it is always located as the first item on the InInitializationOrderModuleList.


After the necessary DLLs are found, it will parse the DLL PE header to find its export table and locate the RVAs of the export function that matches the hardcoded hash calculated at 0x000000DC.

[Note: In order to understand how the shellcode parse the PE header, you need to refer to PE Format Diagram]


Final

I hope to show more detailed analysis like how the hardcoded addresses are generated and show you how the export function is actually loaded and called by the shellcode. This requires us to do dynamic analysis using OllyDBG with a "bait" file. I hope there is guideline on the Internet as I am lazy to find it now ;)

I really hope to share how it can be done. Hopefully I can motivate myself and share the knowledge here asap.


References

http://zarestel.blogspot.com/2008/06/swf-exploit-cve-2007-0071.html
http://zarestel.blogspot.com/2008/06/swf-exploit-cve-2007-0071-part-2-how-to.html
http://blog.threatexpert.com/2008/05/flash-exploit-goes-wild.html


Signing off
~x9090


Sunday, May 24, 2009

SWF Exploit Analysis - Part 1

It has been a while since my last post dated on 4 April 2009. Today I'm gonna to tell about the technical analysis on SWF (Flash Video) exploitation file.

Tools Needed
Overview

The analysis is divided into 2 parts. The first part will explain the decompress the SWF file and extract embedded exploited SWF file. After that it will be followed by how to locate and extract the obfuscated shellcode.

The second part will explain how to deofuscate the shellcode and its payload.

Analysis of SWF

This is the screenshot of the original exploit SWF file to give you an image on how does the file looks like:


It is totally unreadable huh! ;) That is because the SWF file was compressed by looking at the first 3 bytes CWS. We can dump tag by using swfdump.exe from SWFTools:

C:\bin\swftools\swfdump.exe -atpdu flash.$wf > flash.swf.swfdump


Output:


continuation...


Notice that there are a number of pushstring commands, which are the hex code of the exploited SWF files. They will generate the same exploited SWF file. Extract one of the hex string from the pushstring commands into UltraEdit, like this:


Copy and paste the hex string and press a SAPCEBAR (yes, a SPACEBAR!!!) to create a hex code 20. After that press Ctrl + H to switch to hex mode:


Double click 20 and press Ctrl + R to replace the space with hex string:


Click Replace All button and the result would be:


Under Hiew:


It is now more readable right ;)

Now we can use swfdump.exe again to see the tag and we need to find DEFINEBITS section where the shellcode is located:

C:\bin\swftools\swfdump.exe -atpdu exploit_swf > exploit_swf.swfdump

Output:


From the DEFINEBITS section, we can know the starting offset of the shellcode as well as its end offset:

[image continuation]


So we should find offset from aa 02 34 d1 to 11 67 8a 37 using your any hex editors as you like:


continuation:


And the obfuscated shellcode looks like this:


Conclusion

We got the shellcode from the exploited SWF but we still do not know what its payloads. In the next section, I will explain how to deofuscate the shellcode by looking for the "key" in order to deobfuscate it and some common techniques used in shellcode like using PEB to find the kernel32.dll and then looking for the address of LoadLibrary to load the necessary APIs in order to execute its payload.


To be continued...

Saturday, April 4, 2009

Manual IAT Recovery Using ImpREC

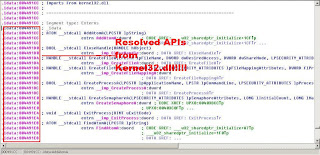
There are a lot of tutorial on the Internet teaching how to use ImpREC to recover Import Address Table (IAT). But those tutorials are only covered using the "Auto IAT Search" function by Imprec. The "auto" function is not able to fully recover the IAT like this:


How do we determine these are the unresolved APIs? Try using OllyDbg, find the OEP, it is fairly easy to find it if the sample was packed by UPX ;) , and Follow in Dump -> Memory Address to any API's call, for example:


Now in the Memory Dump window, switch to Address view and then you can see the list of APIs:


These are the IAT that we missed just now when loading it to IDA. So the next thing is to recover this so that we can continue static analysis on IDA. Scroll up until 0 byte memory address which is beginning IAT relative virtual Address (491cc) and scroll down until 0 byte memory address which is the ending IAT relative virtual address (49338).

Dump the sample using OllyDump, then we can start ImpREC to recover the IAT using the starting RVA we found just now. Using the AutoSearch button will give us:


Notice that the original IAT RVA found at 49284 seems to be incorrect. If you fix the dump with this option you will see the unresolved APIs as shown in the first figure. So we need to set the OEP, RVA and Size (49338-491cc) manually and select Get Imports:


We can now fix the dump using Fix Dump button, select the file that was dumped by OllDbg just now. Done! Next we can load to IDA and see the result:


Signing off
~x9090

Wednesday, April 1, 2009

Customd Detection and Removal Tool

A big april fool worm was setup to be activated today, but it seems that the worm get many security expert disappointed. There are no major havoc caused by this worm yet (at least at the time of writting this blog 12:05 GMT).

For those who suspect their PC is infected with this machine, the easiest way to find out is by visiting some security related websites for example:

  • www.symantec.com
  • www.microsoft.com
  • www.macfee.com
  • www.f-secure.com
and etc.

Conficker/Downadup was designed to block the infected machine from visiting these security websites to prevent victims to find solution to remove this worm. For more technical details on how it prevents from visitng the websites (hooking the Windows API DnsQuery from dnsapi.dll) :

http://mtc.sri.com/Conficker/addendumC/ <-- This is so far the most consolidated analysis that I have ever seen :) The following website is the consolidated methods of detection and removal for Conficker/Downadup from dShield:


http://www.dshield.org/diary.html?storyid=5860


Using Nmap to Perform Conficker Test

I was attracted by the new Nmap scanning features which include the script to scan your network to test if you are infected with the Conficker, thanks to Honeynet Project (Tillmann Werner and Felix Leder) :D

nmap -PN -T4 -p139,445 -n -v --script=smb-check-vulns --script-args safe=1 [host]

typical scan result for infected machine:

Host script results:
| smb-check-vulns:
| MS08-067: FIXED
| Conficker: Likely INFECTED
|_ regsvc DoS: VULNERABLE

The testing was done using Nmap4.85BETA6

Signing off
~x9090

Sunday, March 1, 2009

Adobe Reader 9 and Acrobat 9 0Day Vulnerability

Adobe Reader 9 and Acrobat 9 found to be vulnerable to a 0day exploit where Adobe is planning to release the patches on 11th March 2009:

http://secunia.com/blog/44/

In the first place, the security specialist said that users can be protected by disabling the Javascript on Adobe, which can be found here:

http://www.4shared.com/file/90132463/a01aa640/Adobe_JS_Fix.html


Lately security specialist from Secunia reported that disabling the Javascript cannot eliminate all the risk, more information can be found here:

http://www.adobe.com/support/security/advisories/apsa09-01.html

Conclusion

The only mitigation is avoid opening PDF document from unknown source or cross the finger to wait the 11th March 2009 to reach :)

Thursday, February 12, 2009

Now is F-Secure??

Another security company, F-Secure who has the same fate as Kaspersky, was hacked today. However the hacker claimed that there was no sensitive information leaked for this time.

More information:

http://hackersblog.org/2009/02/11/f-securecom-sql-injection-cross-site-scripting/
http://www.theregister.co.uk/2009/02/11/psystart_website/

Wednesday, February 11, 2009

Kaspersky Was Hacked??

On Feb 7 2009, Kaspersky was reported to be hacked by a Romanian hacker who is known as Unu. The hacker used a simple SQL injection technique to compromise the one of the famous antivirus companies, Kaspersky. Many security sepcialists as well as the security enthusiasts have commented on this incident.

The hacker claimed that they can access all the data hacked but Kaspersky denied that. They can only know the tables and fields in the database but not the data within it. I have attached the links which are considered to be most technical discussions in regards to the security breach.

Enjoy ;)

~~x9090

Kaspersky Incident Analysis:

http://www.viruslist.com/en/weblog?weblogid=208187633

Unu's Blog (with proof of vulnerability screenshots):

http://hackersblog.org/2009/02/07/usakasperskycom-hacked-full-database-acces-sql-injection/

Saturday, January 24, 2009

Faizal.js -- Custom Detection and Removal Tool

I have created this custom detection and removal tool for faizal.js. This JS worm is very easy to be removed manually. However this tool is aimed for some non-tech savvy users that need easy removal steps.

Symantec has a good description on the infections and the removal steps as well:

http://www.symantec.com/security_response/writeup.jsp?docid=2008-050709-5710-99&tabid=3

FaizalRemover - Custom Detection and Removal Tool

Features:
[+] 2 modes, detection and removal mode
[+] Detection mode > Detect faizal.js infection. It will report to you if infection found.
[+] Removal mode > Removal faizal.js, Autorun.inf and other copy of itself on the infected machine.
[+] Kill the worm process to prevent reinfection.
[+] It will remove all the registry keys created by it.
[+] It will restore the IE title bar that was changed by the worm.

Download here:

http://www.4shared.com/file/82263107/5a1b8c38/FaizalRemover.html

Tuesday, January 6, 2009

CIMB's Scam E-Mail

I decided to post this as this is the first time I received scam email related to the local banking website, CIMB. Here is the contents:

From: [Fake email address]
Sent: [Date and Time]
------------------------------------------------------------------------------------------------------
Dear CIMB CLICKS Customer,

We are hereby notifying you that we've recently suffered a DDos-Attack on one our's Internet Banking service
For Security reasons you must complete the next steps to verify the integrity of your CIMB CLICKS account.
If you fail to complete the verification in the next 24 hours your account will be suspended.


Here's how get started:


1. LogIn to CIMB CLICKS online account ( Click here )

2. You must request the TAC online via CIMB CLICKS - your TAC will be sent via SMS to the mobile phone
number you registered at the ATM
( You can find the "Request TAC" button in the left menu of your account ).

3. LogOut from your account and close the browser.

4. When you recivied the TAC (Transaction Authorization Code) on your mobile phone please LogIn to
our secured server
verification server and submit the required information(Account User ID, password and TAC)
( Please click here to go on our secured server. )

5. Please allow 48 hours for processing.


Please compily and thanks for understanding.

© 2009 CIMB CLICKS Internet Banking Service.


Please do not reply at this email.

Notice the link from the first instruction is the genuine CIMB website. It is apparently the attacker is convincing victims to request "TAC" through his mobile phone. This authentication method is infamous and implemented by all the local e-banking. With the "TAC", the attacker can then do anything he wants on the victims' account. The first thing he will probably do is to change the authentication mobile phone to himself so that he can requests more "TAC" afterwards as every transactions done for example, changing password, transfering money and etc require each "TAC".

Afterwards, it required the victims to logout and login to another websites. This is the funny thing I see here :P. Why do you need to logout and relogin again since you can accompolish the verification process at the same page. The attacker claimed that the second URL is "our secured server", that's mean the website that given just now is not a secured one? People with a little common sense would realize that the instructions are not logical at all.
--------------------------------------------------------------------------------------------------------

Nevertheless, the second URL will redirect victims to some rogue banking websites. Immediately after I saw this scam email, I google and found some URLs used by this scam email:
  • http://www.xxx.xxx.xxx.using.ssl.cimb-secured.net/asp/cimb/system.htm?wps/portal/!ut/p/c0/04_SB8K8xLLM9MSSzPy8xBz9QJ_89Mw8_YJ0RUUAk9OZqw!!/
  • http://xxx.xxx.mia.bellsouth.net/services/VerifyTAC/Login/
Both URLs are inactive at the time of this writting. No further analysis can be done here.
So, please don't click the links sent via emails to avoid such attacks.